Exploration 02 - Quadratics
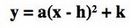
First, I will discuss what is typically referred to as standard form of a quadratic equation, which is in the form of:
Typically, students will start with this format, as they will denote a quadratic equation by being a polynomial to the second degree, which is easily seen in standard form. Standard form allows us to translate into vertex and factored forms, which provide additional information about the function and visual depiction of the function to students. I will discuss these formats in further detail later in this write-up.
When beginning a unit on quadratics, students typically work with seeing versions of a, b, and c (the coefficient variables) as integers, but students should be pushed in the unit to work with real and even complex numbers within the quadratics unit. While students do not have a way to depict complex parabolas, it is important for students to understand that all polynomials in C[x} have roots (Fundamental Theorem of Algebra: Every non-constant single variable polynomial with complex coefficients has at least one complex root.).
Students generally will begin exploration by understanding what translations occur to the quadratic function by altering the values of a, b, and c in this format via graphing tools and animation tools. I prefer students to play in desmos with this function via the following link and describe the translations that occur with each different coefficient variable manipulation. (Click on the image below to perform the activity yourself!)
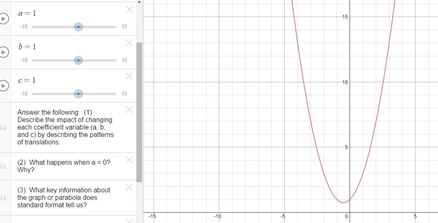
I have included prompting questions to discuss with students as notes in the Desmos file (https://www.desmos.com/calculator/ccahicr5bj):
(1) Describe the impact of changing each coefficient variable (a, b, and c) by describing the patterns of translations.
I first will discuss the impacts that a and c to translate the quadratic function, and end with discussing the transformations generated by changes to coefficient variable b, as often this coefficient is the most difficult for students to see and discuss.
a: There are two transformations that leading coefficient a can cause that should be discussed.
The first transformation that students typically describe is the difference in the way the function appears when a>0 (a is positive) and a<0 (a is negative). Many students will describe a positive leading coefficient as one that causes the function to “point up” and a negative leading coefficient as one that causes the function to flip or “point down.” Students should be able to discuss and arrive at the fact that multiplying the leading coefficient by a negative number causes a vertical reflection to occur as we want them to describe transformations with the appropriate vocabularly. Students are often very confused by this, as they will describe the parabola as being reflected over a horizontal axis, so they reason that it must be a horizontal reflection. A good way to clear this up with students is to ask them what the reflection impacts, the domain or the range? If they can see that this particular reflection causes a change in the range, which shows the possible y-values or output of the function, then they can often understand why this is called a vertical reflection. Now technically, there is also a horizontal reflection that has occurred over the x-axis due to the fact that in standard form, we have two x-variables, but I think it better to discuss this as a shift in vertex in vertex form. I think this will be too confusing for students. Just make sure students know to describe –a as a vertical reflection, as this will be a common case in vertex form.
The other transformation students often see is that the absolute value of the leading coefficient causes a dilation of the parabola shape. If students struggle to see this, you might try creating multiple graphs and having them relate it to the parent function. When |a|>1, students will often describe the dilation as a “stretch” of the function or describe this function as becoming “skinny.” Students will claim that when 0<|a|<1 that the function is “widened” or “fatter.” We want students to relate this dilation to the dilation that occurred in linear functions by discussing the changes that occur to the rate of change of the functions. Students can see and explain why when |a|>1 the rate of change is growing faster than the parent function, and when 0<|a|<1 the rate of change is growing slower than the parent function. They should also note that the rate of change is not-constant like it was in a linear function, which is why the dilation is MUCH easier to see! This is also a great time to preview derivatives in calculus by discussing what the rate of change is at different points in the function! Students should still see that the parabola maintains its shape, despite the dilation that has occurred.
c: This is usually the first coefficient that students notice and like to discuss. They very quickly see that the constant coefficient causes the function to translate up c-units or down c-units (if c<0). They might also point out that c is always the y-intercept. Students should understand why the constant coefficient is always the y-intercept.
b: Generally, students will state that if b>0, the function translates b units to the right and if b<0 that the function translates or shifts b units to the left, but you have to discuss why it is not that simple! First, they should check the coordinates! The function in most cases will not shift b units to the left or right! We need vertex form to make that call! Also, ask students what happens when a<0. They should see that when b>0 that the function now shifts to the left and when b<0 that it shifts to the right. Again, it’s that pesky additional x-variable that caused another reflection on us in standard form, so we will need another form to really understand this shift!
The key here is that students should see via animation that changes to b does cause a translation pattern, one that is the shape of another parabola! This will be a key connection students need when they start learning about how a parabola is a conic section and start describing it’s shape in terms of the focus, directrix, and right triangles (distance).
(2) What happens when a = 0? Why?
Students should see that when a=0 that a linear function occurs. This is because when a=0, the leading coefficient is now b and we no longer have a quadratic function. We have a linear function. This is why the function does not maintain the shape of a parabola!
(3) What key information about the graph or parabola does standard format tell us?
Hopefully, your students see that standard form gives us some idea of the transformations that have occurred on the quadratic function that we can start describing (dilation, vertical reflection, horizontal/vertical shift), as well as providing the y-intercept of the function. They will see in the future of future units that standard form is key to transforming polynomials and functions into different formats and having a general idea about their shape. But, students should very quickly see that standard form does not give us enough information to graph our quadratic function, and we need a way to better understand where the vertex point belongs (horizontal translation) and how dilation will look. That will come with other forms and better understanding of a parabola!
Now is where you take a deep breath as you are about to enter the zone of the quadratic unit where students begin to loath you, quoting “too much work for this.” But, move onward, vertex form is so important in setting your students up for understanding function shapes and transformation patterns!
Ok, before I get into vertex form, I offer a little aside…while it might be easier to say to your students to do the following:
1) Get your equation for f(x) into standard form, and label a, b, and c.
2) Define h as (-b)/2a
3) Define k as f(h).
4) Your vertex is at (h,k) and vertex form is f(x)=a[(x-h)^2]+K
5) To find your roots, set f(x) = 0 and solve for x by reversing the order of operations.
You just threw a random procedure at your students. While this only took a day or two to teach and allowed you to give them more practice time with factoring, this process is now void of meaning. –b/2a is so important in terms of the quadratic formula proof and the method of completing the square! I think now is the time to introduce what completing the square is, as it will only enhance your factoring and quadratic function discussion!
I could discuss completing the square in a few page essay. There are some decent videos online with examples of the method depicted visually (like this one: https://www.youtube.com/watch?v=Ax2mIah7bkQ). I highly recommend exploring how the quadratic formula is derived through visual depiction of the completing the square method.
But I digress, again, we let our students do some exploring in Desmos, as we are talking about transformations and key features in this exploration (Again, click on the link below):
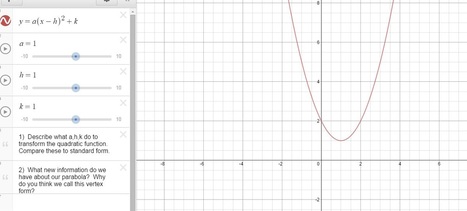
1) Describe what a,h,k do to transform the quadratic function. Compare these to standard form.
a: Students should see that a behaves exactly it behaved in standard form!
h: Students should see that if h>0, the function translates to the right h-units and if h<0 then the function translates to the left h-units. Only, this time, the translation is NOT impacted by the value of a. Students should understand why that is (think –b/2a!) PLEASE HAVE THEM UNDERSTAND THAT THERE IS A NEGATIVE SIGN IN VERTEX FORM IN FRONT OF h, THEY WILL GET CONFUSED!
k: Students should see a translation, k units up if k>0 and k units down if k<0.
Students should see that the translations are much easier to understand in vertex form because they are LINEAR.
2) What new information do we have about our parabola? Why do you think we call this vertex form?
Students should see they now know where the vertex and line of symmetry are. They should also note that the vertex is the point in the graph where the function shifts from positive to negative or negative to positive (if you have time, draw that derivative). Students will also note that they can define the minimum or maximum point in the function (which they will need calculus to do for most of our other polynomial functions. We still need our roots (x-intercepts) and a better concept of our dilation, but students will soon see that we can find our roots by solving our vertex form for x in this unit.
Now, I am going to end the write up with the following suggestions:
-Move onto factored form, there are many methods to choose from, but make sure your students understand what the general concept of factoring is! Give them enough practice time too! From here you can talk about multiple factoring helpers: Rational Root Theorem, AC Method, Monic Factoring, Eisenstein’s Criteria, Descartes Rule of Signs, etc if you have time. It is really important that students understand what roots/solutions/zeros are from now on graphically as it will come up every unit!
-Save the quadratic formula for last, otherwise your students will not pay attention to the foundational material with these other methods! Push your students to define what the determinant tells you both descriptively and visually. Also, make sure to discuss different kinds of roots and extensions to number systems! Why did these number systems historically evolve! I believe Bramagupta was credited with originally writing down a version of the quadratic formula. Review the proof with students in connection to completing the square, it is quite eloquent.
-If time permits, extend vertex form into defining what a parabola actually is in terms of a conic section. Using visual depiction for students and have them find the focus and directrix. This helps emphasize why b in standard form translates in the shape of a parabola as well!